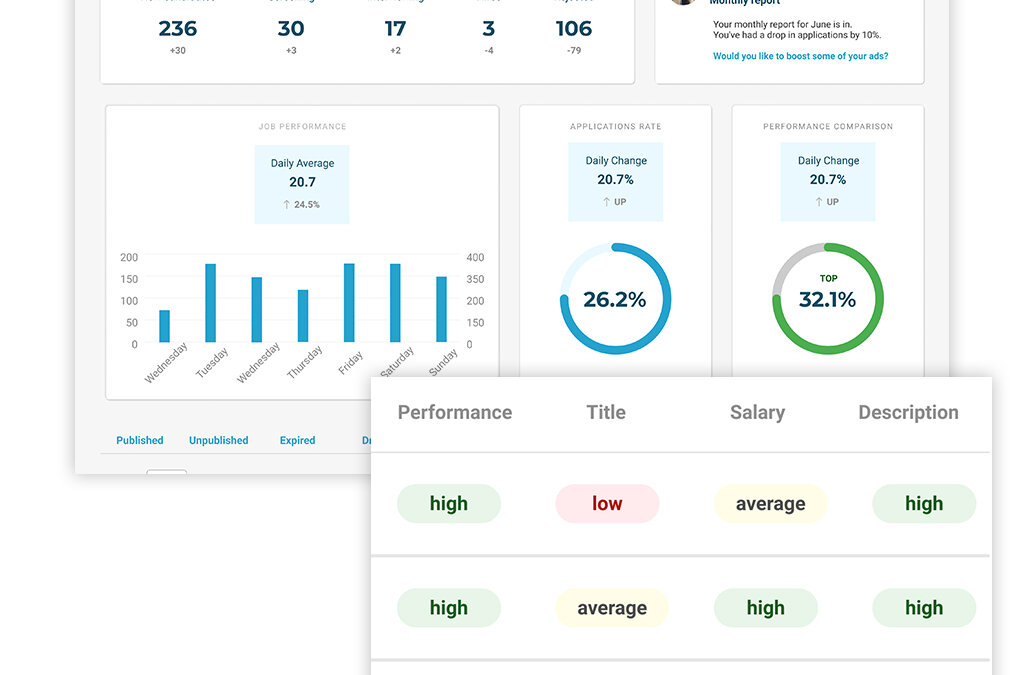
In this guide we’ll be taking a closer look at the job performance table, which you can find at the very bottom of your Reporting area.
This table gives you the most in-depth insights out of all the reports on your account, providing you with a super-detailed look at each of your jobs and the specific factors affecting their performance.
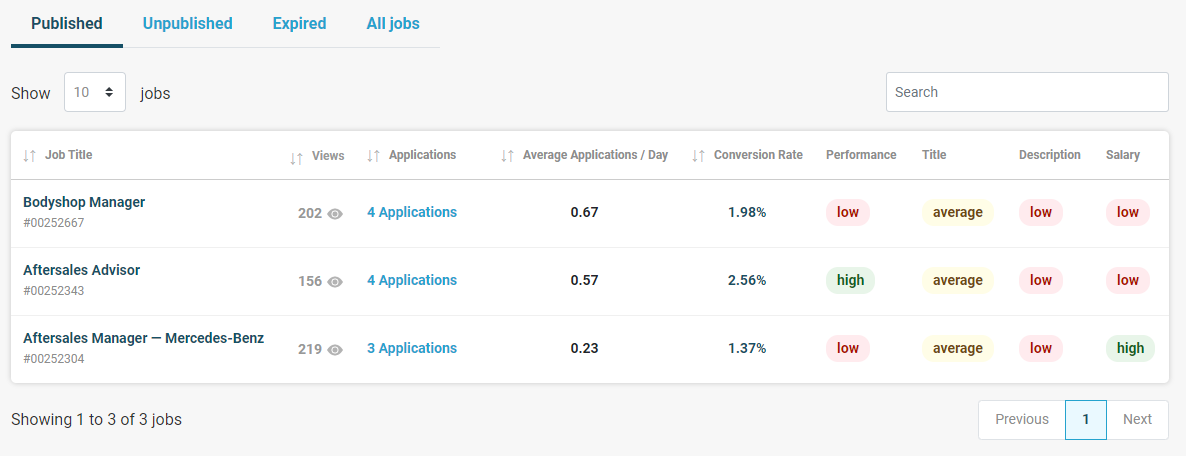
Across the top of the table you’ll see tabs letting you choose between viewing your Published, Unpublished, Expired, or all jobs. It’s important to note that whatever dates you’ve selected at the top of your Reporting area will impact what appears in this table; if you’re looking back at last month, for example, the numbers that you see in the table will count up the views and applications each job received last month. If you then change the dates to look back at the last 7 days, the numbers in the table will change to reflect these dates.
Tip – if you are looking for a particular job from within an extensive list, use the search bar above the table to quickly find the role you’re looking for.
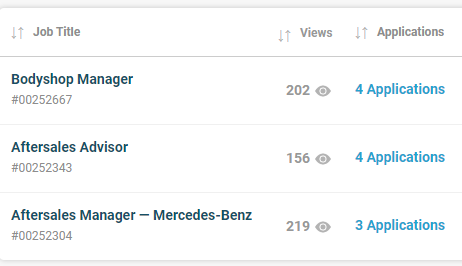
On the left of the table you’ll see how many views and applications each job received during your selected time frame. Click on the column headers to reorder the table if you wish; for example if you want to see which jobs have received the most applications, in order to determine if there are any common trends amongst your most popular jobs. You’ll also be able to click through from the Applications column here to view the applicants for each job.
Next you’ll see columns listing the average number of applications per day that each job received during this period, and what each job’s conversion rate was (the rate at which the views converted into applications). This again is a really handy way of spotting if there are any common trends amongst the jobs that are converting well, whether this be a location-based factor, a certain type of role which is popular at the moment, or something related to the content you’ve included in these jobs’ descriptions.
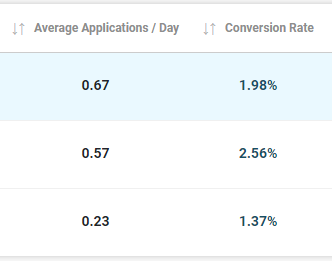
On the other hand, these columns can also help you spot jobs which are struggling, allowing you to take action sooner to improve this. For example, if you have a job which has been live for a while but is struggling to attract views, you may want to consider whether the job title is likely to make candidates want to click in and learn more about the role; or you may wish to consider one of our Boost options to enhance your job’s visibility on the site.
Or, if you have a job which has received lots of views but has a low conversion rate, this can be a prompt for you to take a closer look at this advert and consider what may be preventing candidates from applying after having been interested enough to click into the job advert and learn about the role. This is where the next section of the table comes in handy.
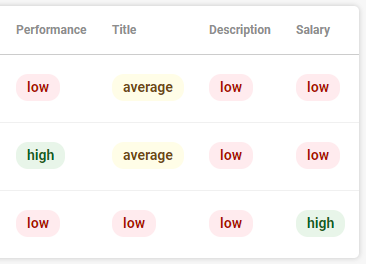
The right-hand section of the table gives you a detailed picture of what factors may be impacting each job’s performance. Using data gathered from the rest of the jobs on the site, we take a performance average for each job category and display how your job measures up in terms of the following factors:
Overall performance
How your job’s conversion rate (views into applications) compares to other roles in the same category
Job title
How your job’s title compares to others from similar roles, taking into account its length and the number of relevant keywords included
Job description
How your job’s description compares to those from similar roles, again taking into account the description’s length and how many relevant keywords are included
Salary
How your job’s salary compares to the average amongst similar roles
Tip – click on the red, yellow or green markers in this section for a reminder of how each factor has been calculated.
These pointers can help you spot whether there may be something specific that could be addressed to help improve a job’s performance, whether this be adding more detail into the description, or looking at whether the salary matches up with the average for that type of role. It can also help you spot what exactly is working for the roles that are converting well, in case there is anything in these adverts that you can replicate elsewhere.
It’s our hope that by providing you with these transparent insights into your jobs’ performance, we are giving you the best possible chance of success. You’re able to take a more proactive approach in keeping track of things, address issues as they arise, and gain a better idea of what works well with your most successful adverts so that you can carry this over to other roles.
Should you wish to discuss your reporting figures in more detail, get in touch here, or if you wish to give any other feedback on your experience using the site, you can do so here.
Improve Recruitment Decisions With Our New Candidate Profiles
In this guide, we’ll be taking you through one of the most significant new features of our new and improved site: the candidate profile. Why we introduced candidate profiles The candidate profile is an alternative to the traditional CV where automotive...
Top time-saving tips when using CV Discovery
In our latest guide to the new and updated features of your recruiter account, we’ll be taking a look at CV Discovery and providing some tips on how to save time during your search. Recent Searches When you access CV Discovery, you’ll see the search bar as...
How to save yourself headhunting time with the Talent Pool
In our latest guide, we’ll be introducing you to the Talent Pool, which is a brand-new feature for our recruiters; we’ll also demonstrate how using this can save you time and effort within your recruitment process. Saving candidates to your Talent Pool The...

